Using Sheeta AI
Dashboards
A dashboard is a grid of charts, tables, slicers and text, each bound to a table in one of your connections. You can build a dashboard by hand or ask the AI agent to build it. Dashboards are saved in the project under .sheeta/canvases/, so they are shared with the project through Git.
Create a dashboard
- Switch the sidebar to Dashboard mode with Cmd+Opt+3 / Ctrl+Alt+3.
- Click + (Create New Dashboard), or Create Dashboard when the list is empty. New dashboards are named Dashboard 1, Dashboard 2 and so on, and open in a tab.
- Right-click a dashboard in the list to Rename or Delete it. Deleting cannot be undone.
Add widgets
Open the Visualizations pane on the right side of the dashboard and click a widget type to add it below the existing ones. The available types are:
- Charts: Bar Chart, Horizontal Bar, Line Chart, Area Chart, Pie Chart, Donut Chart, Treemap Chart and Bullet List.
- Data: Table and Matrix.
- Filters: Select Slicer and Button Slicer.
- Text.
When a chart is selected, clicking another chart type changes the selected chart to that type. Drag a widget by its title bar to move it, and drag an edge or corner to resize it. Select a widget and press Backspace or Delete to remove it.
Bind data
Open the Fields pane to browse connections, tables and columns. Drag a column onto a drop zone of the selected widget. The drop zones depend on the widget type:
- Bar, line and area charts: X-Axis and Y-Axis.
- Bar and horizontal bar charts accept more Y-Axis fields to stack values.
- Pie, donut, treemap and bullet list: Category and Value.
- Table: Row (Group By) and Values (Columns).
- Matrix: Rows, Columns and Values.
- Slicers: Filter Field.
Values can be aggregated with SUM, COUNT, AVG, MIN or MAX. Date fields on an axis can be grouped by day, month or year. Each widget also has these settings:
- Title: show or hide the title and edit its text.
- Data Labels on bar, horizontal bar, pie, donut and treemap charts.
- Filters with =, !=, >, <, >=, <=, LIKE and IN.
- Sort ascending or descending.
- Limit: the maximum number of rows, from 1 to 10,000.
Text widgets show your own text, or the aggregate of a dropped field, with a font size from 12 to 72 px, normal or bold weight and an alignment. The dashboard-wide Color Palette can be Default, Vibrant or Earth.
Filter and highlight
- A Select Slicer shows a dropdown of values with search, Select all and Clear. A Button Slicer shows one button per value; click the active button again to clear it. Slicer selections filter every other widget on the dashboard.
- Click a data point in a chart, table or matrix to highlight the matching data in the other widgets. Shift+click selects more than one point. Click again to clear the highlight.
Slicer and highlight selections reset when you restart the app.
Refresh and present
Click Refresh in the dashboard header to run every widget's query again. Results are cached for five minutes, and dashboards do not refresh on their own.
Click Presentation Mode to show the dashboard full screen with moving and resizing locked. Press Esc to exit.
Build dashboards with the agent
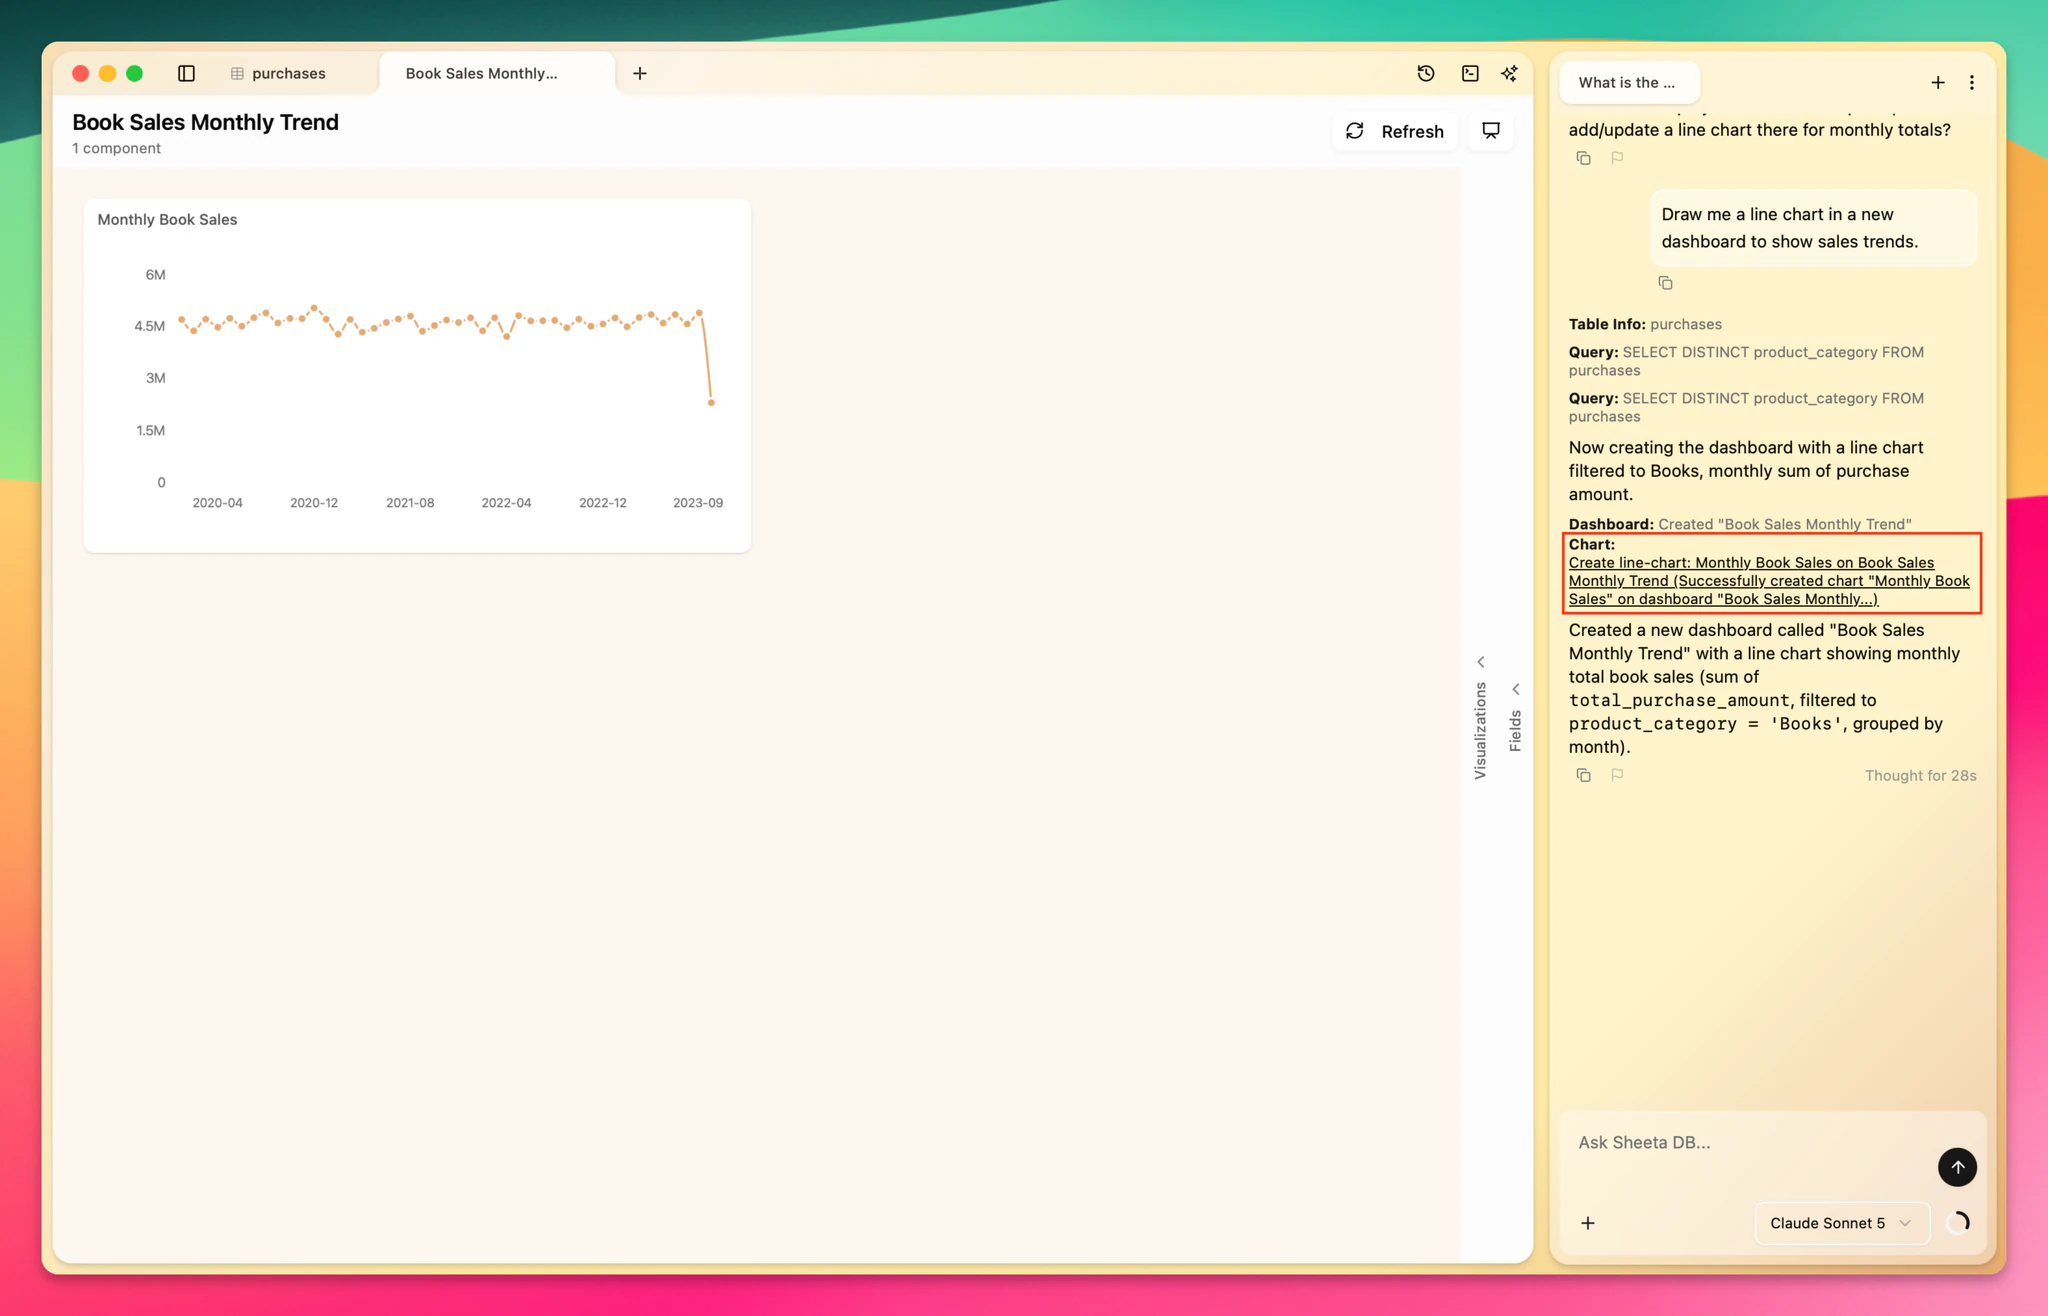
Ask the agent for a chart, for example "Draw me a line chart in a new dashboard to show sales trends." The agent creates the dashboard if it does not exist and adds the widget. Click the dashboard or chart card in the chat to open it.
Limits
- Widgets read from tables. There is no custom SQL widget.
- Dashboards and charts cannot be exported.